What’s the biggest risk to your long-term returns? Is it inflation? Interest rates? Energy prices? What if I told you that the biggest risk to your long-term returns was probably you? What's maybe even more surprising is that the risk isn't that you're doing too little, it’s that you're probably doing too much!
The average investor makes too many decisions and the result of all this decision-making is lower returns. While the idea of expending energy to end up with less might not be an intuitive idea, it’s widely observed in investing. Activity is typically linked to emotions like fear and greed. One day an investor may feel the fear of missing out on the next hot trend, and by the next day they could fear a market downturn. The markets have a way of making investors manic and myopic – two traits that almost assure unpleasing long-term results in investing.
The clearest way to show the impact of overactivity is by comparing the returns of the average equity investor relative to the market. Between 1991 and 2021, the average equity fund investor earned an annual return of 7.1%, while the S&P 500 Index grew at an average annual rate of 10.7%. To frame this differently, if you had invested $20,000 in 1991 and earned 7.1% annually, you would have $156,572 by 2021 – not bad! However, if you had invested that same $20,000 and earned 10.7% annually, you would have $422,142 by 2021, almost three times as much money! Small differences in annual return can lead to very large differences in wealth over time.
Equity funds – Average investor vs. index returns
Dec. 31, 1991 to Dec. 31, 2021

Source: “Quantitative Analysis of Investor Behavior, 2022", DALBAR, Inc. Returns as at December 31, 2021 in US$. The average equity fund investor represents the investor return on investments of a universe of both domestic and global equity mutual funds. It includes growth, sector, alternative strategy, value, blend, emerging markets, global equity, international equity, and regional equity funds. The S&P 500 Index is a broad-based, market-capitalization-weighted index of 500 of the largest and most widely held U.S. stocks. The index chosen to compare average investor returns may not be appropriate for every investor. Differences including security holdings and geographic/sector allocations may impact comparability. Redistribution rights from DALBAR, Inc.
The cost of being a good neighbour
The market is zero sum, meaning that for every winner there’s a loser. What typically causes people to lose when investing is the fear and greed mentioned earlier, often leading to activity at the wrong time. While you have probably heard the expression "buy low, sell high", the reality is that most investors do the opposite. They get scared and sell low and then buy back at higher prices when they feel excited. What these investors don't realize is that they’re donating their performance to other more disciplined investors. For someone to win, there must be a loser. The next time you're worried about a recession, inflation or a correction in equity markets, and your emotions tell you to sell, just ask yourself, "Am I comfortable giving my performance away to my more disciplined neighbour?"
Most investors don't have an appropriate appreciation for the distribution of market returns. Eight of the 10 worst days for the market occurred within one week of the 10 best days! In other words, the best and worst day typically happen in the same week or so. Any investors who sold on the worst day almost certainly missed the best day. Earlier I discussed how small differences in annual return can lead to very large differences in long-term wealth. A hypothetical investor who invested $20,000 for all but the five best return days between December 31, 1979 and June 30, 2022 would have seen their savings grow to $1,309,562, compared to $2,112,152 for someone who stayed invested for the entire period. Missing the 40 best days over the period meant losing almost half of their annual returns. Hopefully you still like your well-disciplined neighbour...
S&P 500 Index – hypothetical US$20,000 investment
Dec. 31, 1979 to Jun. 30, 2022

The figure illustrates the cumulative growth and annualized returns of a hypothetical US$20,000 investment in S&P 500 Index. Best and worst days are those with the highest and lowest daily returns between December 31, 1979 and June 30, 2022, respectively. Total returns in US$. The S&P 500 Index is a broad-based, market-capitalization-weighted index of 500 of the largest and most widely held U.S. stocks. The chart above is used only to illustrate the effects of missing the best days and is not intended to reflect future values of an investment.
Lost in the shuffle
In many cases, investors don't outright sell when they’re emotional, but instead change their allocation. When they fear a market downturn, they sell one thing to buy something they consider more “safe” and defensive, such as a business in the consumer staples or utilities sector. They tell themselves that they can wait out the volatility and then switch back to their long-term investments on the other side. While this may feel good emotionally, it typically leads to worse long-term results. The reason is that what feels like a single decision is actually a series of decisions:
We aren’t at the bottom of the market yet → I should reposition my portfolio
There’s downside risk in my current holdings because the market isn’t accurately reflecting the future in today’s stock price → I should sell my long-term holdings because they will underperform in the near term
The market is accurately reflecting the future in the stocks of defensive businesses, such as consumer staples → I should buy these because they will outperform in the near term
I will know the exact day of the market bottom → I can switch back to my long-term holdings at the right time
Remember how important it is not to miss the best days? What seems like a simple decision to switch allocation is actually a daisy chain of events that all need to go in the investor’s favour to create a successful outcome. In sports betting they refer to this as a "parlay."
Let's pretend that this hypothetical individual is one of the greatest investors to ever live and they get 80% of all their calls right. After all, the odds of getting all four decisions right aren’t great:

In other words, this asset switching would work less than half the time. If we assume the average investor has odds closer to 50% of getting each decision right, that implies a 6% chance of getting all four correct. To paraphrase Obi-Wan Kenobi, "These are not the odds you’re looking for.”
Tilting the odds in our favour
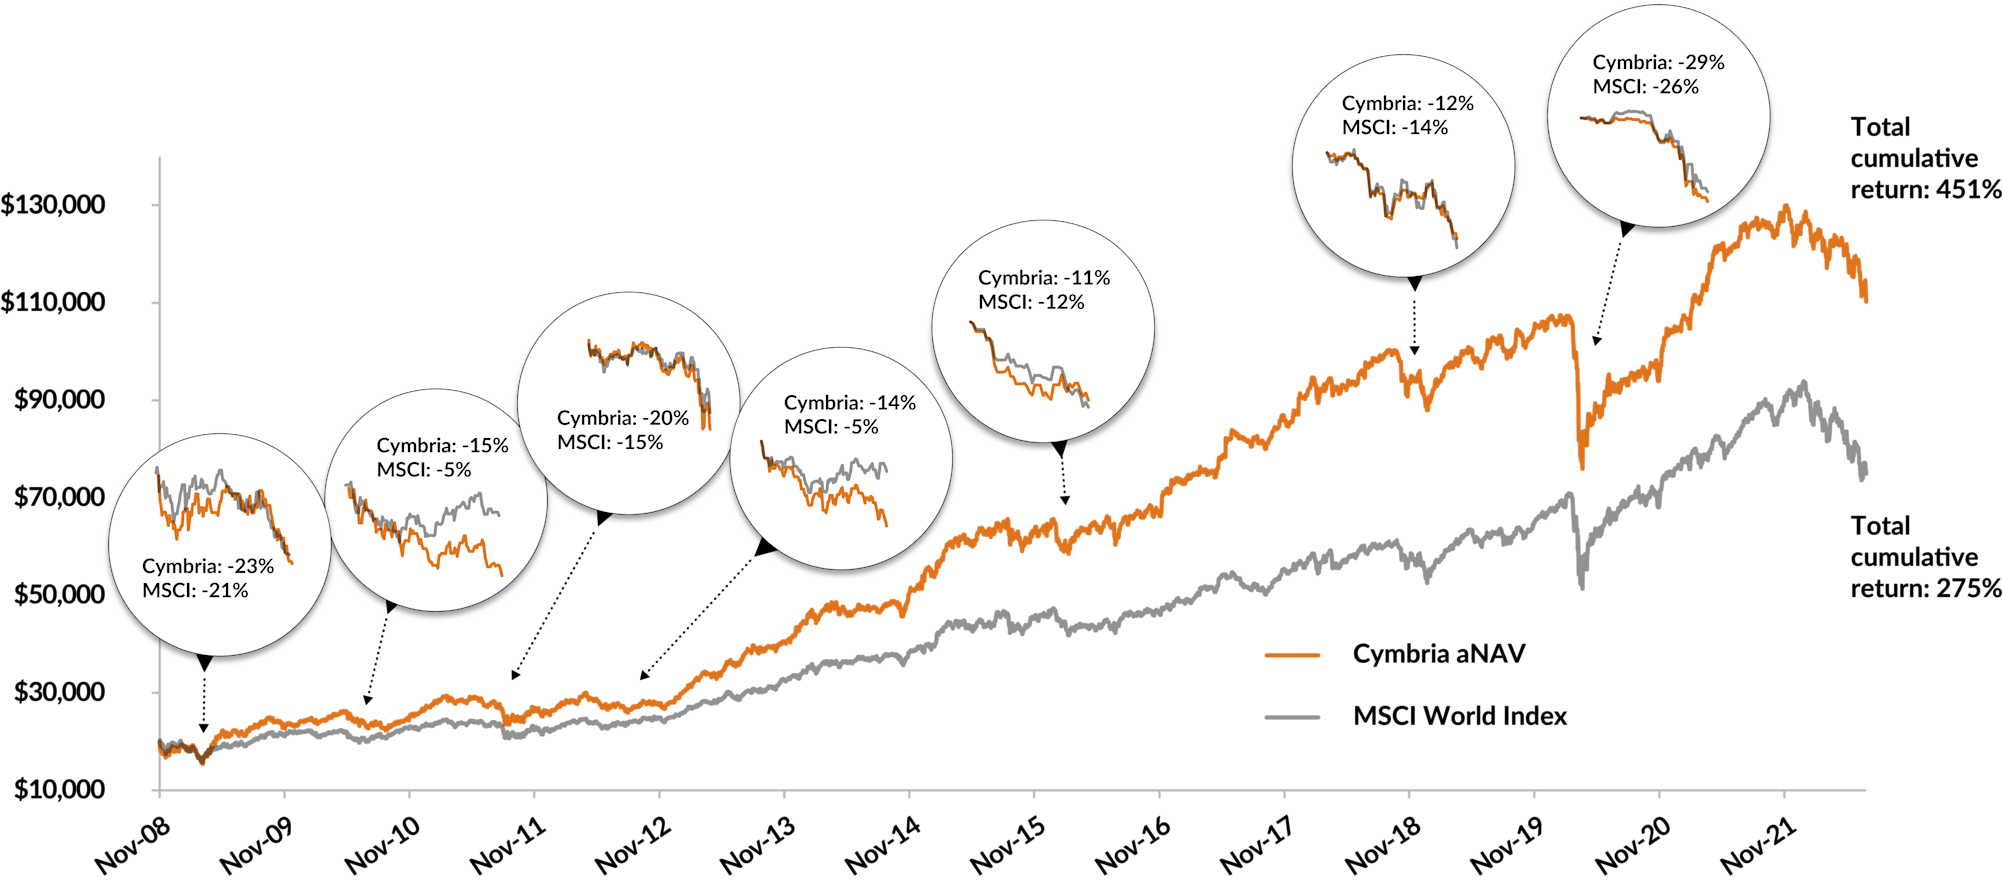
Like many things in life, perspective plays an important role in this problem. The more myopic an investor becomes, the more likely they are to succumb to their emotions and make mistakes. Over the history of Cymbria there have been eight periods when Cymbria’s Class A aNAV was down by at least 11%. We’re currently in the eighth decline, but let’s look at the previous seven for some valuable perspective:
Growth of $20,000 Cymbria Corp., Class A aNAV vs. MSCI World Index
Nov. 4, 2008 to Jun. 30, 2022

Annualized total return, net of fees in C$ as at June 30, 2022
Cymbria Corp., Class A aNAV - YTD: -13.75%; 1-year: -12.15%; 3-year: 2.61%; 5-year: 6.04%; 10-year: 14.81%; since inception (Nov. 4, 2008 to Jun. 30, 2022): 13.32%. MSCI World Index - YTD: -18.82%; 1-year: -10.77%; 3-year: 6.54%; 5-year: 7.52%; 10-year: 12.12%; since inception (Nov. 17, 2008 to Jun. 30, 2022): 10.16%.
Source, index: Morningstar Direct. Total returns, net of fees, in C$ as at June 30, 2022. First decline: November 3, 2008 to March 9, 2009. Second decline: April 29, 2010 to August 24, 2010. Third decline: February 21, 2011 to August 19, 2011. Fourth decline: April 2, 2012 to August 2, 2012. Fifth decline: December 29, 2015 to February 11, 2016. Sixth decline: September 4, 2018 to December 24, 2018. Seventh decline: January 19, 2020 to March 23, 2020. The MSCI World Index is a market-capitalization-weighted index comprising equity securities available in developed markets globally. We manage our Portfolios independently of the indexes we use as long-term performance comparisons. Differences including security holdings and geographic/sector allocations may impact comparability and could result in periods when our performance differs materially from the index.
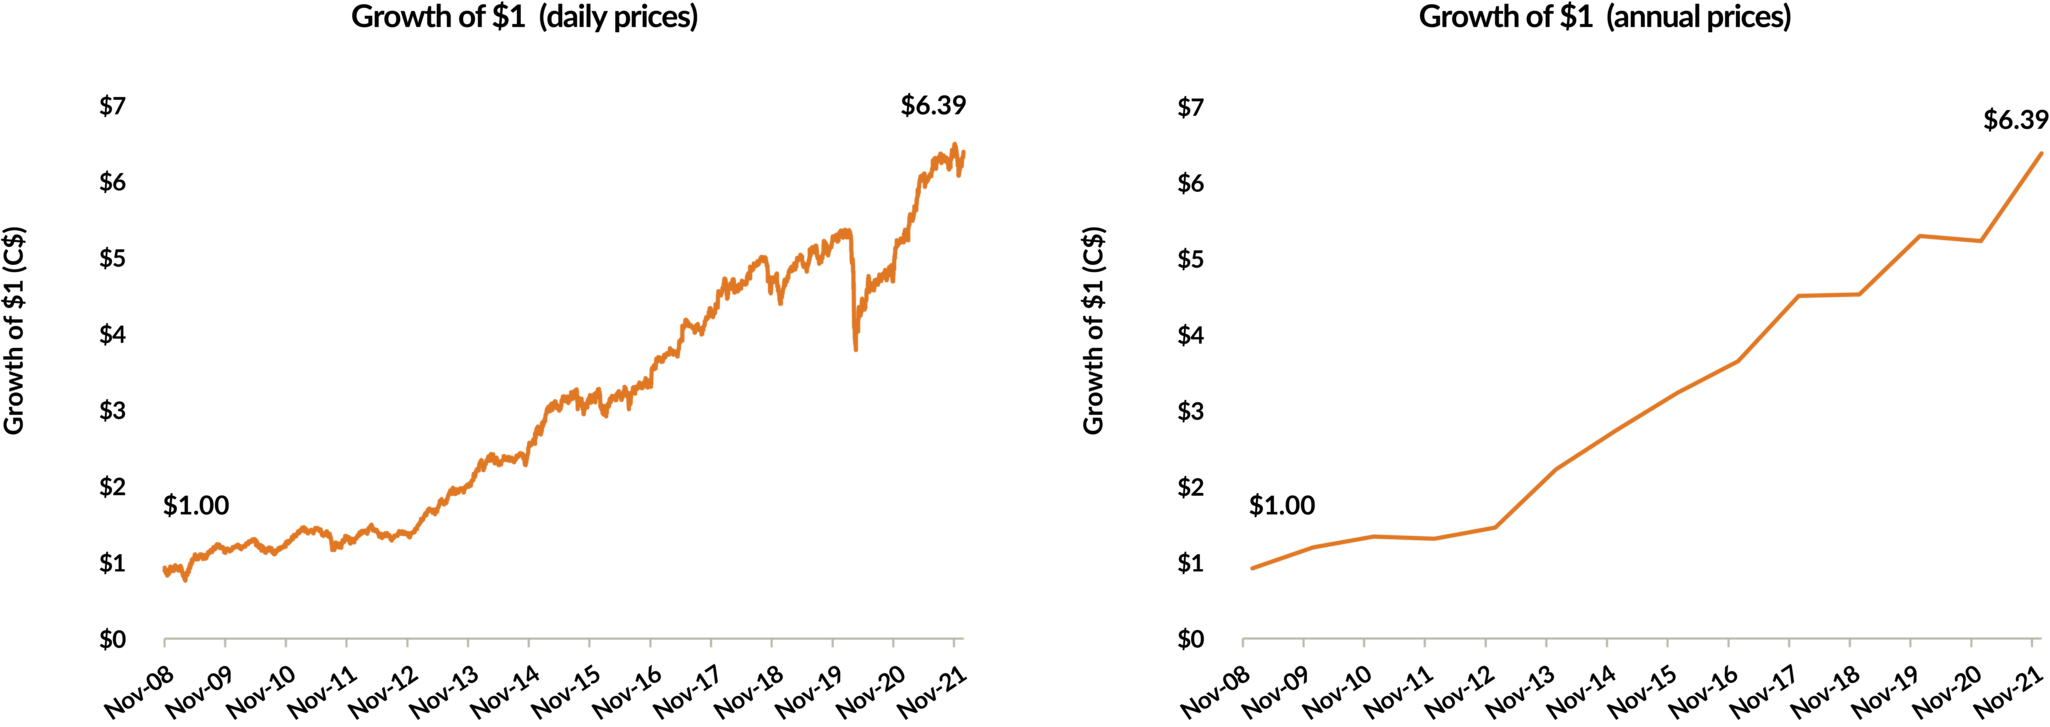
When performance is viewed on a daily basis, these declines can feel painful and deep. When we look at performance on an annual basis, we see little trace of these time periods.
Growth of $1 – Cymbria Corp., Class A aNAV
Nov. 4, 2008 to Dec. 31, 2021

Annualized total return, net of fees in C$ as at June 30, 2022
Cymbria Corp. aNAV
YTD: -13.75%; 1-year: -12.15%; 3-year: 2.61%; 5-year: 6.04%; 10-year: 14.81%; since inception (Nov. 4, 2008 to Jun. 30, 2022): 13.32%.
As at December 31, 2021. Total returns, net of fees, in C$.
Our job at Cymbria is to get you to your Point B. You should think about performance in terms of an overall timeframe that spans the day you bought until the day you sold. For most investors, Point B is many years into the future.
The ingredients for great investing are straightforward – a proven and disciplined approach, a long timeline and a willingness to act against the emotions of the crowd. Our approach has been around for more than 50 years and has navigated investors through all types of market and economic environments. The foundation of our investment approach was built on a long-term view and independent thinking, and we strive to instill those same principles in our partners.
We thank you for your trust and work hard to be worthy of that trust.